Numerical
The Numerical strategy visualizes (x, y) coordinates.
Intent
It mainly aims to answer:
- What is the relationship between two variables?
- How does a variation in one variable affect the other?
Presentation metaphor
Data, together with Numerical with frequency.
Context meta-model
The context meta-model of Numerical contains a single class, Target, with two numeric attributes x and y.
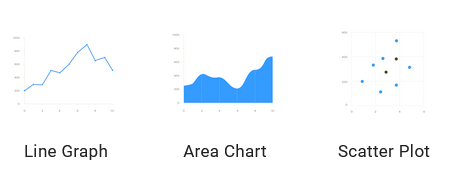
Visualisation variants
There are three available visualizations:
- Line Graph and Area Chart, ideal for data ordered by the X axis; and
- Scatter Plot, for independent x and y values.
Properties
title: string [1..1]. Title of the visualisation.X_label: string [0..1]. Label for the x axis.Y_label: string [0..1]. Label for the y axis.
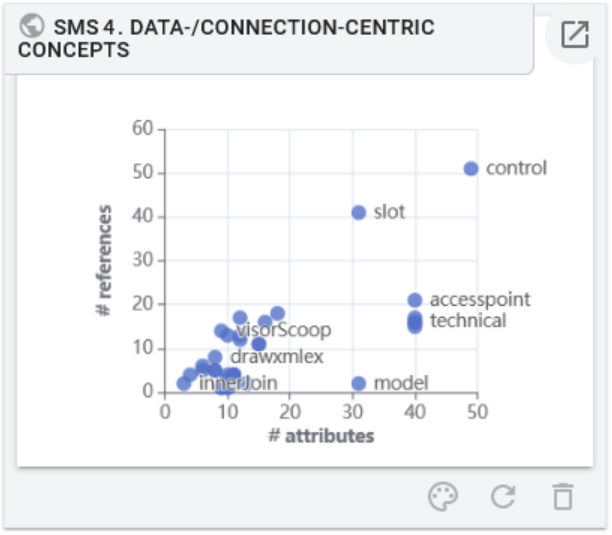
Motivating example
The strategy can be used to understand the "size" of meta-model concepts in a single chart. In particular, it associates the X and Y coordinates to the number of attributes and relationships of a concept, respectively.
The mapping is domain-agnostic, so it can be reused for any meta-model:
Target→SemanticNodex→/ this.getDataProperties().lengthy→/ this.getObjectProperties().length